NQ Futures Forecast March 25-29, 2024
Tags: Market Forecast · NQ Futures · NQM2024
By Raonak Ahmad
Overview
We share our perspective and expectations regarding price performance in this post. Our market review is short term in nature and we do not offer any financial advice here; rather, this post serves as a planning and educational platform - the first of many to come. The instrument we plan to examine, and aggressively trade in the week ahead, is the Nasdaq Futures' June 2024 expiration e-mini contract (Ticker: "NQM2024") traded on the Chicago Mercantile Exchange. This overview covers price perspectives and expectations across multiple time frames via key vectors including inefficiencies, naked liquidity pools, and institutional order block identification where applicable.
Let's get into it.
4 Hour Timeframe Review
Below is a simple candlestick view of the NQM2024 price activity since March 21, with each bar representing a 4 hour timespan. We start here with a classic, "naked" chart, and then apply our analytics.
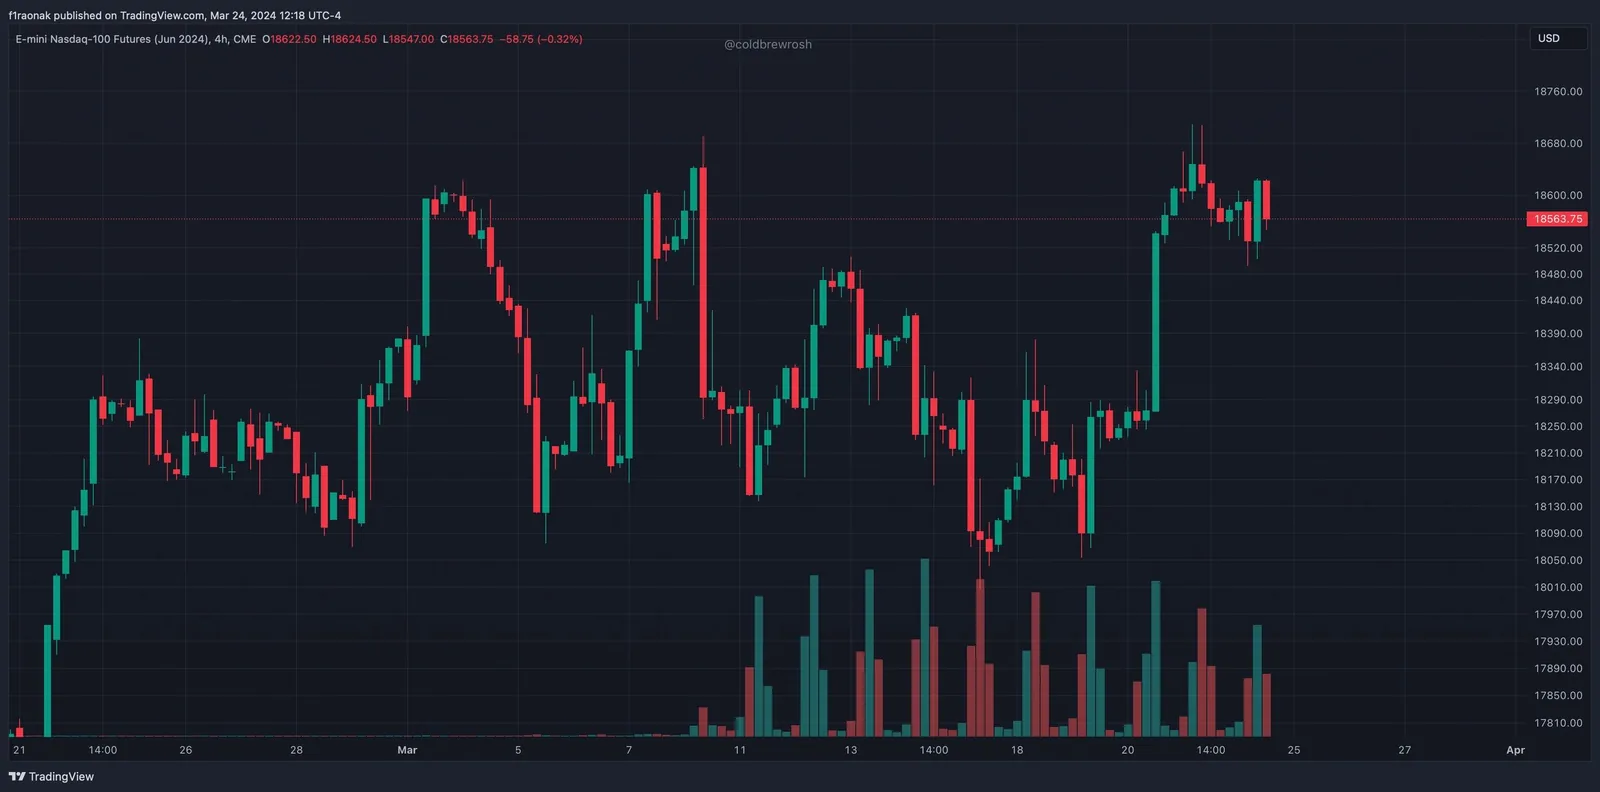 Full-size chart
With analytics:
 Full-size chart
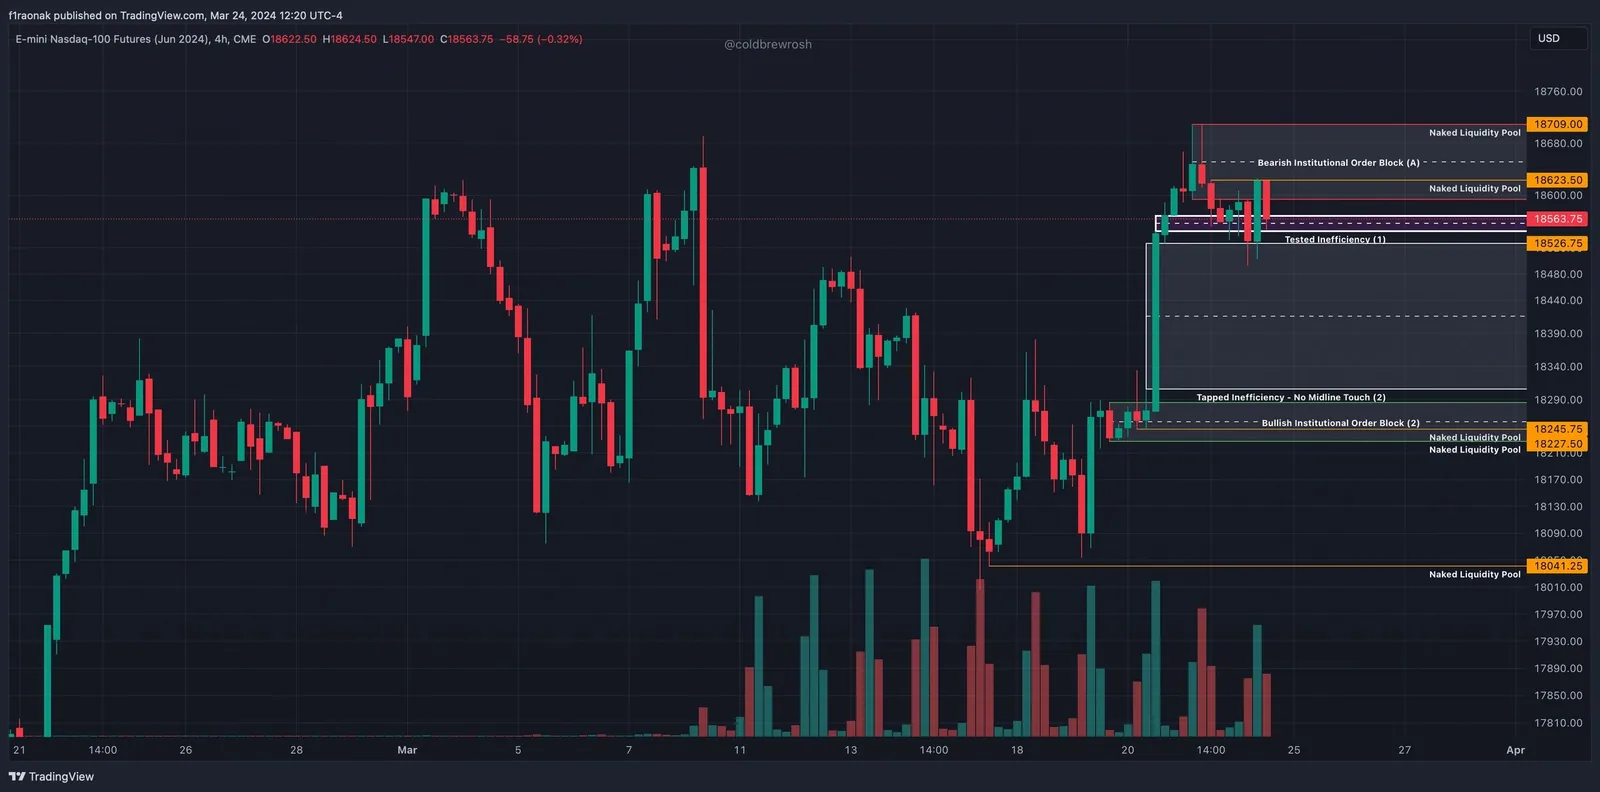
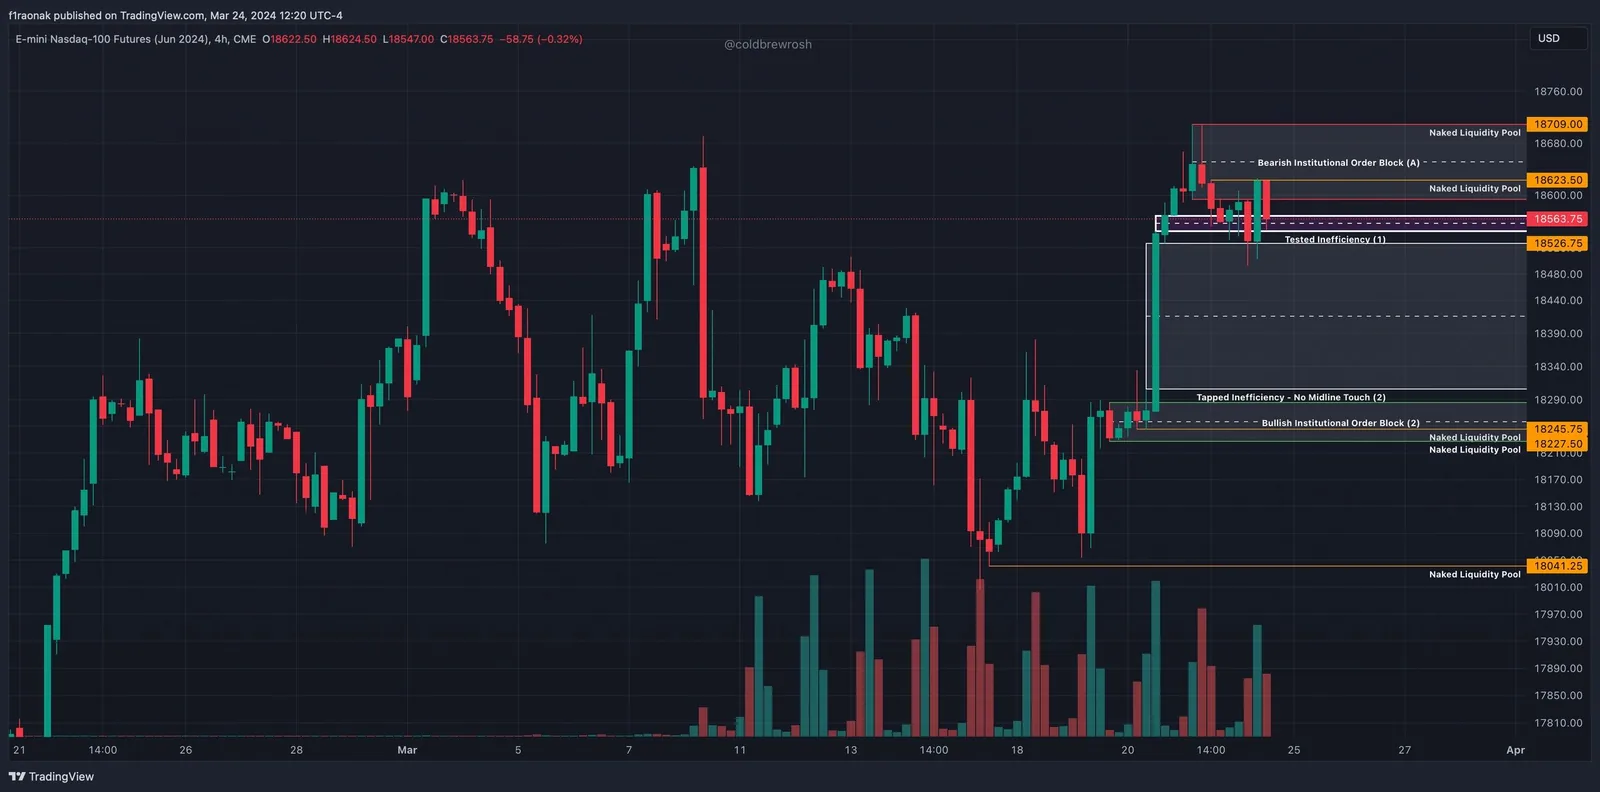
Looking at the 4 hour timeframe with the analytics in place, we notice price revisiting the all time high of 18,691 set on Friday, March 8, 2024. This revisit happened on Thursday, March 21 during the NY AM session coincident with the latest unemployment numbers released by the Bureau of Labor Statistics (BLS).
Price exceeded the prior 18,691 all time high with a new value at 18,709 during the NY cash open volatility spike. Price failed to exceed the new all time high value for the remainder of the day - and week. Price took naked liquidity set early last week on Friday, March 22 fully testing the "Tested Inefficiency (1)" area of the marked chart. On this basis our initial directional thesis for the early part of this coming week is a push higher to three areas of interest for high probability short positioning:
- Naked liquidity pool @ 18,623.50
- Midline of the bearish institutional order block (A) @ 18,650ish
- Double top candle formation / naked liquidity pool at 18,709
A breach and hold of each of these levels negate the short thesis with expectations of prices moving north of 18,709 through the week.
Price tends to regress to the mean threshold of glaring inefficiencies; 18,416ish is a clear area of interest on the down side. The probabilities of this level getting a touch in the next 3-10 days is greater than 60% on average. We also have eyes on the bullish institutional order block (2) and naked liquidity pools in the 18,225 to 18,260 range. These are areas of interest for short term long positioning. 18,041 presents a clear target for shorts entering new contracts in the aforementioned short interest zones while offering an area of high reward/low risk long interest. We expect a violent reaction from a variety of market participants at the 18,041 area.
1 Hour Timeframe Review
 Full-size chart
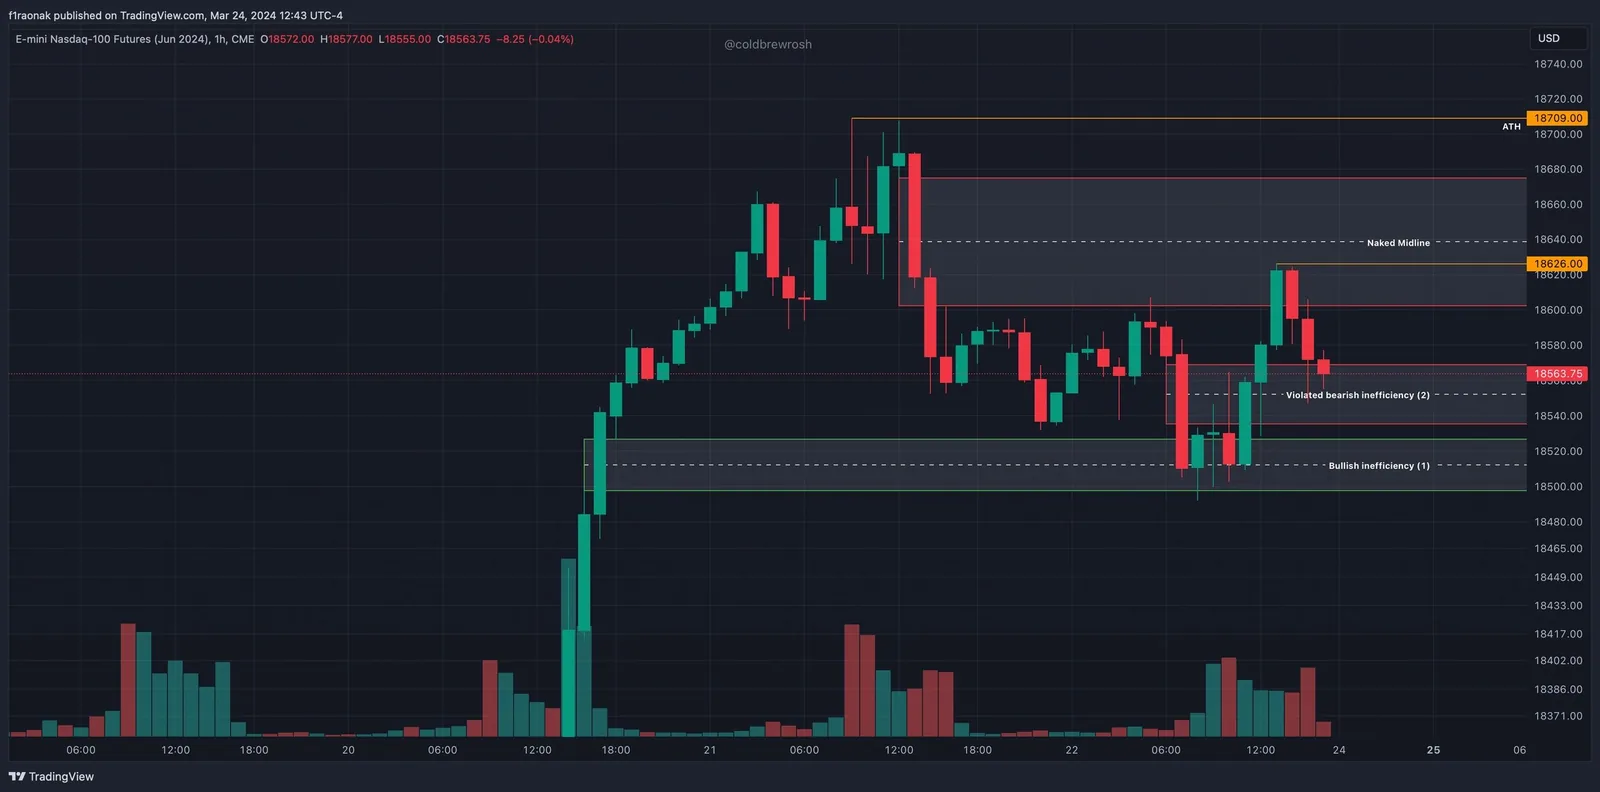
Looking at price on the basis of one hour candles paints a more acute, surgical view. Taking into consideration the prior zones of interest, the one hour view provides a compelling argument for an overall bullish sentiment until price breaches the following levels:
- Naked liquidity pool @ 18,626
- Naked midline @ 18,640ish
- All time high at 18,709
These levels offer profit lock targets for inter-day long positions opened lower as well as short areas of interest for new short positioning - both for inter-day, fast action volatility capture. We may touch these levels as early as Sunday evening 1800 EST into Asia and London sessions or NY open Monday and beyond into Wednesday or Thursday. Should we see a bullish opening week we can expect price to revisit the naked liquidity trails on the downside created along the way (offering longs an opportunity to participate).
Rationale behind early week bullish thesis:
Price tested the bullish inefficiency zone (1) last week, failed to break, and pushed higher into the naked midline's environmental box. In doing so price reversed the strong bearish price action (though on lower volume) creating the violated bearish inefficiency zone (2) in high volume. Though not marked on the chart, price broke the bearish market structure and offered longs a decent risk/reward entry with a re-visit into the violated bearish inefficiency (2) zone late Friday afternoon (1500-1700 EST). Smarter traders avoided this seemingly attractive entry given market closure at 1700 EST with a reopen on Sunday, March 24 at 1800 EST.
 Full-size chart
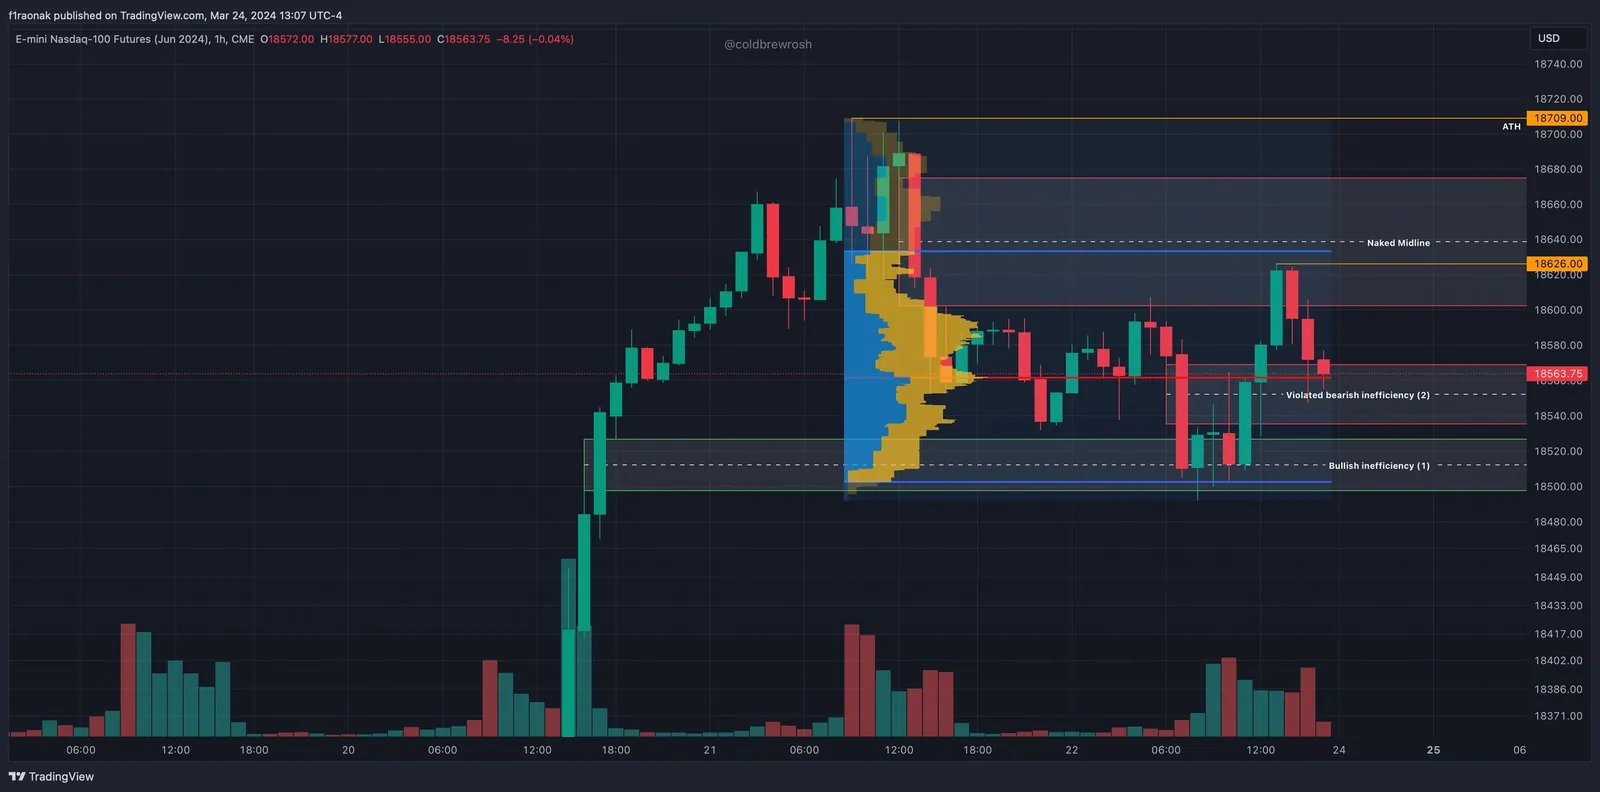
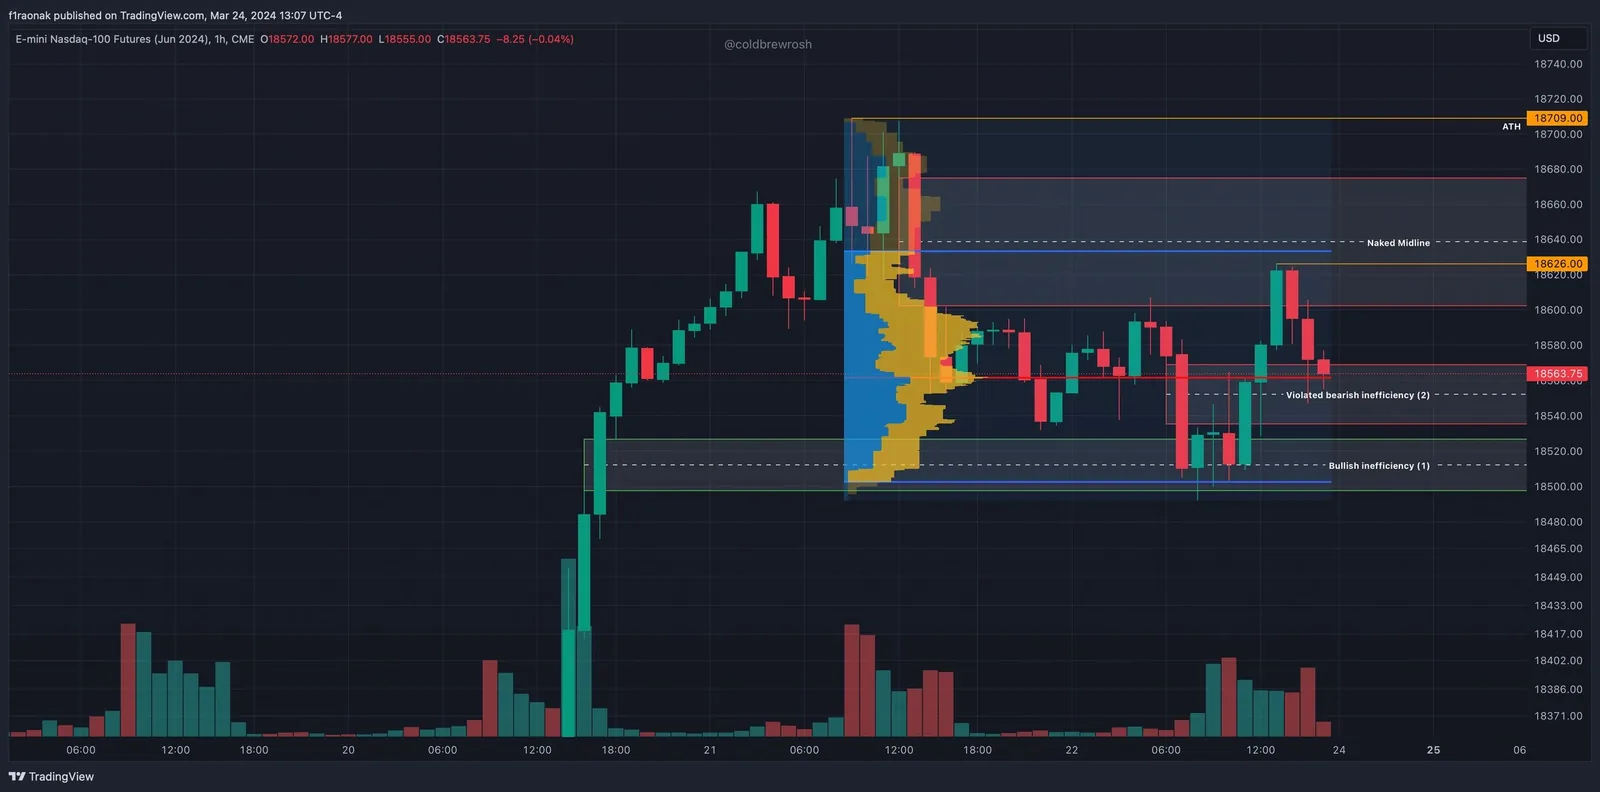
One more layer to consider on the analytic side on the 1 hour view is the composite volume profile overlay. The composite view aggregates traded volume from March 21 to close of March 22 and highlights buy/sell transactional activity by price level (as opposed to time). We can see a few key points of interest:
- 68-70% of price volume near our 18,626 naked liquidity target ("value area high")
- The highest volume node ("point of control") at 18,563 where price found a downside support floor into close on Friday, 1700ish EST
- Hard, bullish bounce on the the touch of the lower bound distribution level @ 68-70% ("value area low") around the 18,500ish neighborhood
Our forecast is bullish for the early part of the week ahead with either continuation if we blow through the earlier mentioned short entry points or correct deeper south of 18,500 later in the week and into the week after.
External Volatility Injection Forecast
We expect volume and volatility spikes during certain external events. We have eyes on the following this coming week:
- Monday @ 0825 EST: Pre market volatility, minor, with FOMC member Bostic remarks and 1000 EST new home sales data release
- Tuesday @ 0830 EST and 0900 EST - minor spikes with core and durable goods orders m/m release
- Tuesday @ 1000 EST - heavy volatility spike with consumer confidence data
- Wednesday @ 1030 EST - minor spike with crude oil inventory release
- Thursday @ 0830 EST - major volatility spikes with final GDP q/q, and BLS unemployment claims data
- Thursday @ 1000 EST - major volatility spikes with pending home sales and revised consumer sentiment and inflation data followed by 1030 EST minor news of natural gas storage
- Friday @ 0830 EST - major volatility spikes with Core PCE data, goods trade balance, personal income, personal spending, and preliminary wholesale inventory data
Considering the release schedule of major data, we expect price to reach for early bullish targets and remain somewhat range bound with price exiting the Monday through Wednesday range formation on either Thursday or Friday, coincident with back to back high impact data releases.
Let's revisit forecast next Sunday and see how the story actually unfolded - maybe a mid-week update makes sense too.
Have a great week,
/R
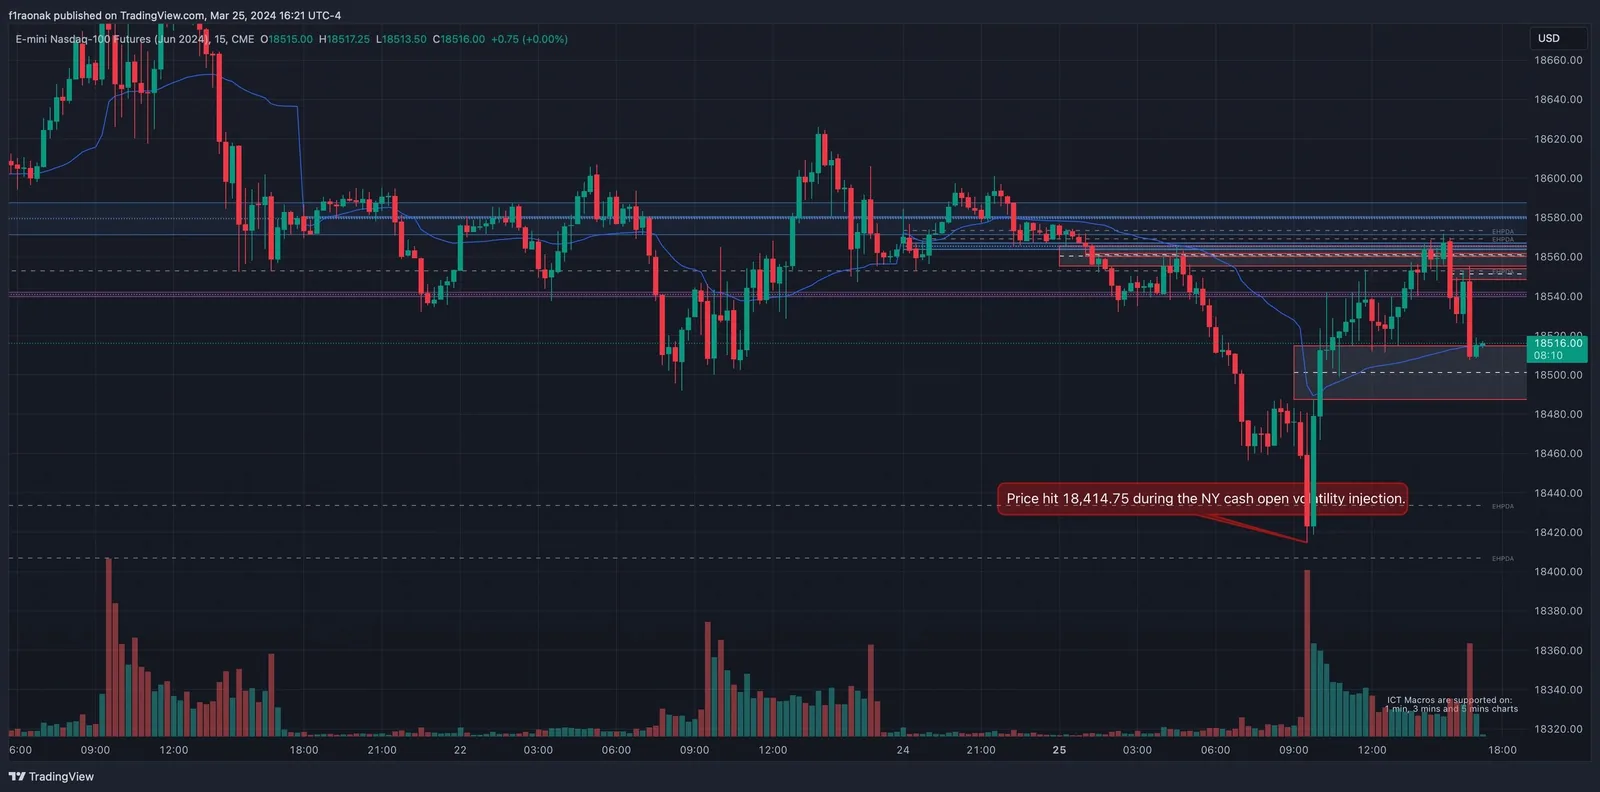
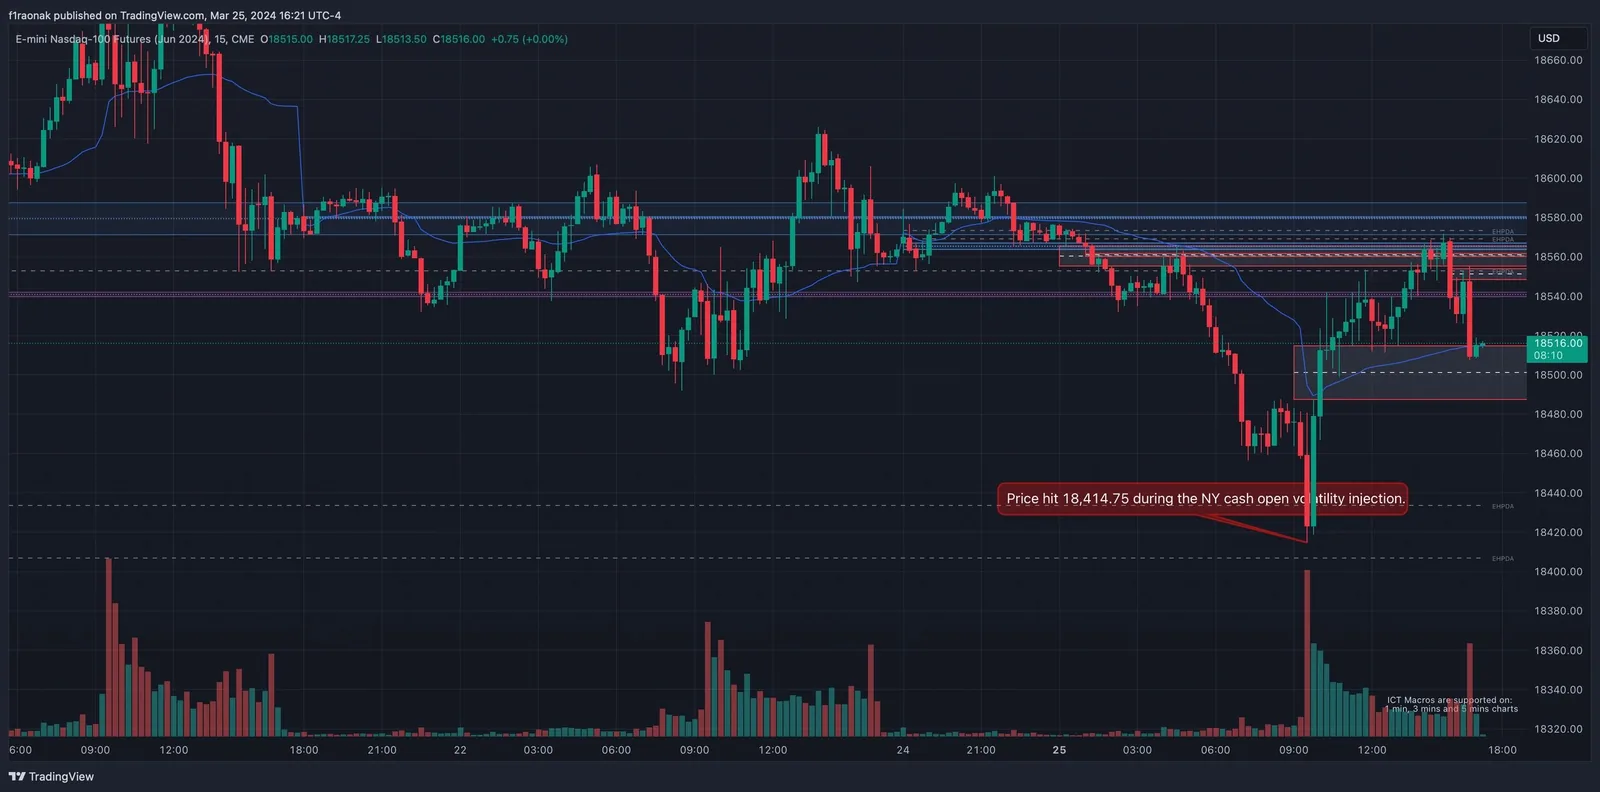
PS - a brief update entry: Price hit the one of the highlighted downside targets within 24 hours of this post:
 Full-size chart