Mid May 2024 Market Commentary
Tags: Market Forecast · NQ Futures · NQM2024
By Raonak Ahmad
We close out last week with a few notable data events: PPI, CPI and Unemployment Claims. This post discusses the impact of these major data releases on the Nasdaq Futures along with possible scenarios for the week ahead (May 20-24). Let's get into it!
High Time Frame View
 Full-size chart
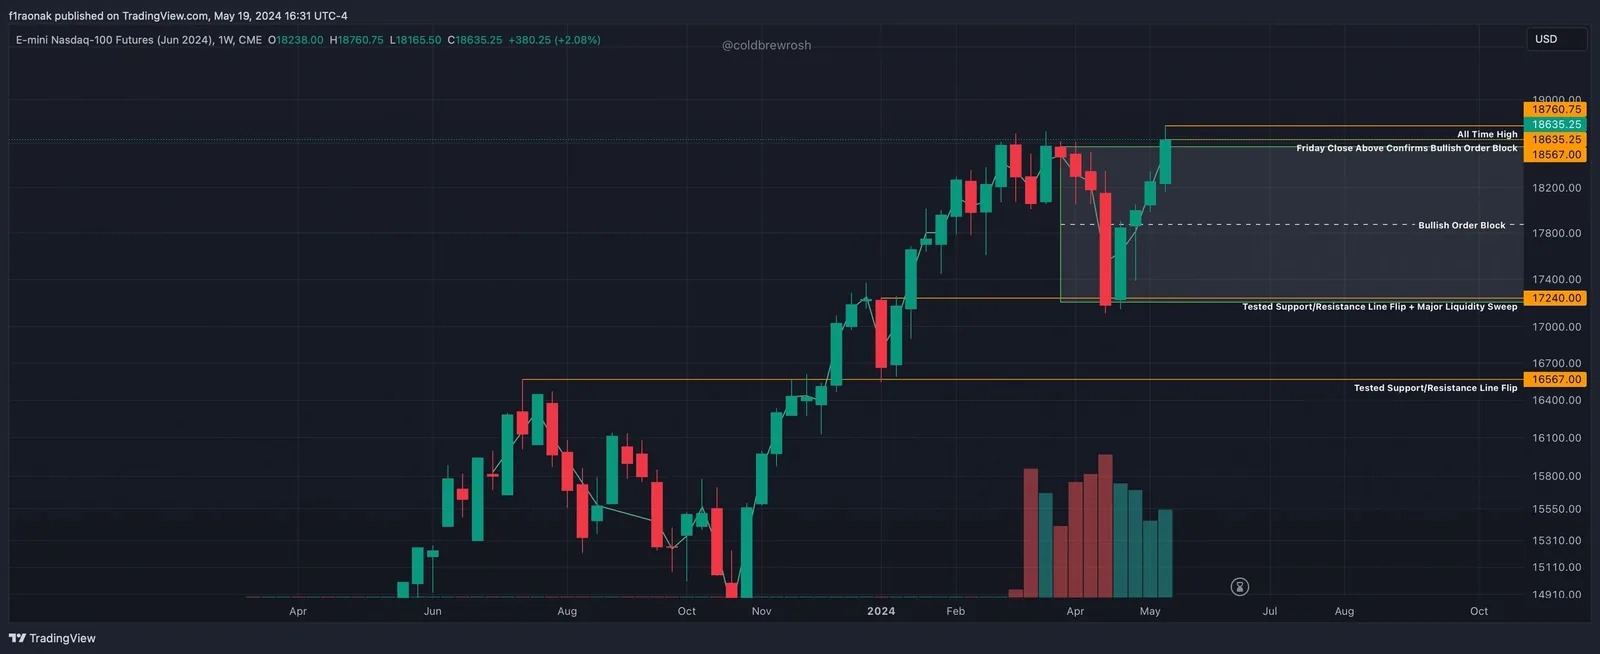
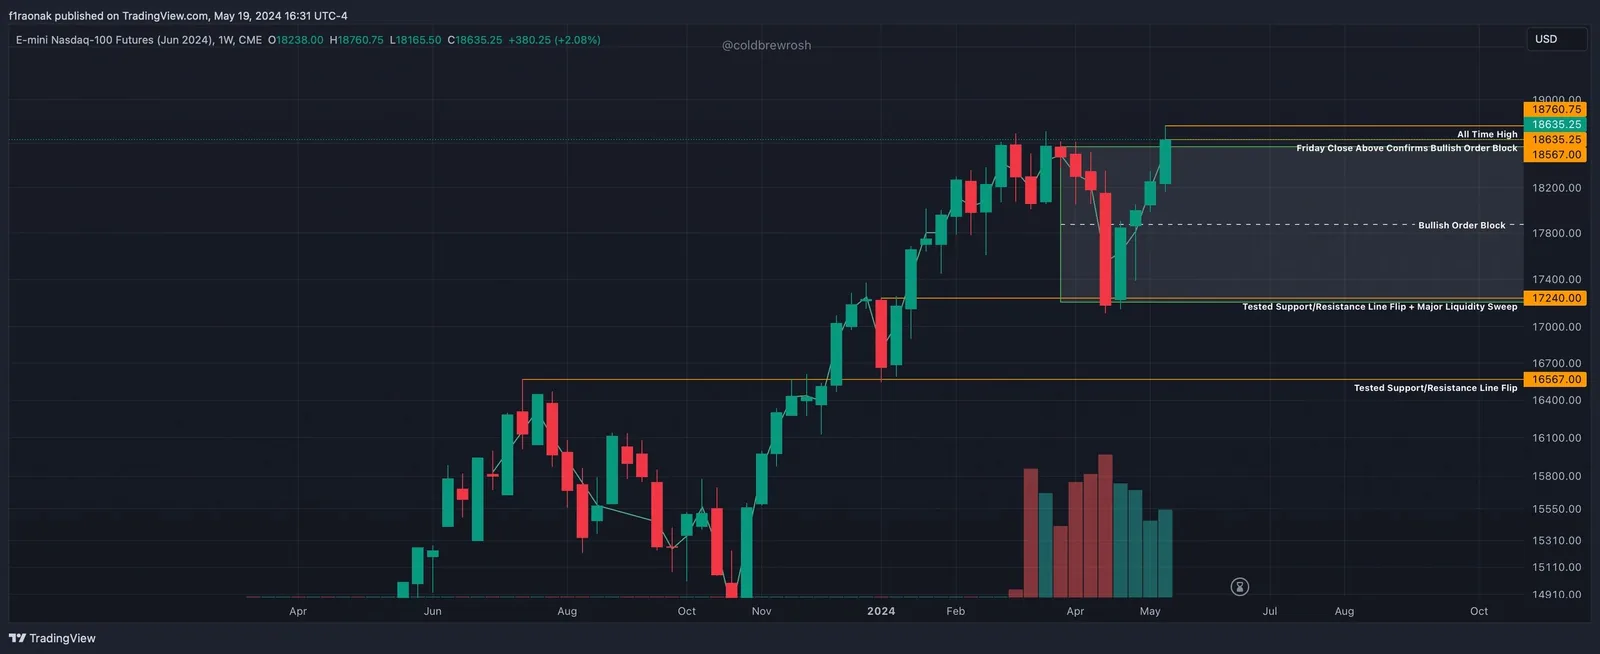
Let's examine the weekly time frame. We note two points of interest where demand dominated supply: 16,567 and 17,240. Both flips happened in late Q4 2023 and early 2024 with a retest of 17,240 during the week of 15 May. From a higher time frame we can confirm price is in a clear bullish posture and there is zero evidence otherwise to date. This past week, price achieved its all time high in both cash and futures markets, the latter at 18,760.75 points. Notably, price did not regress very far; in fact, bulls managed to close price above 18,619 (weekly open from 25 March) thereby created a technical bullish support condition known as an order block. The order block range is significant: 17,180 to 18,619 with a mid point around 17,886. The bear case takes shape if prices declines into this range. The bear case confirms if this range flips into resistance and we aim for our 17,240 and 16,567 levels as our first area of short target profit points going into summer and fall. However, as of now, we continue to look north until bearish evidence factually materializes.
Economic Data Impact
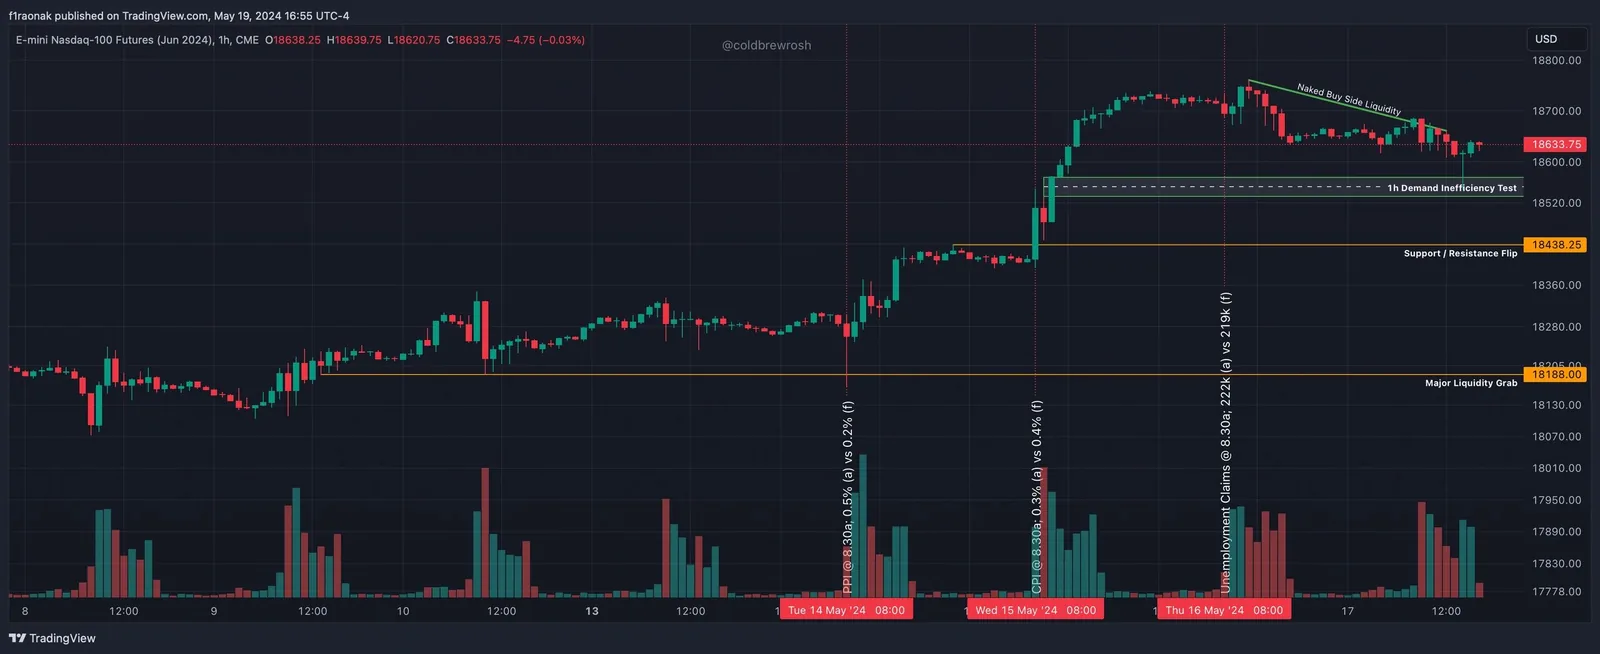
Let's drop into the 1 hour time frame view of the NQM4 charts and examine economic data impact this past week.
 Full-size chart
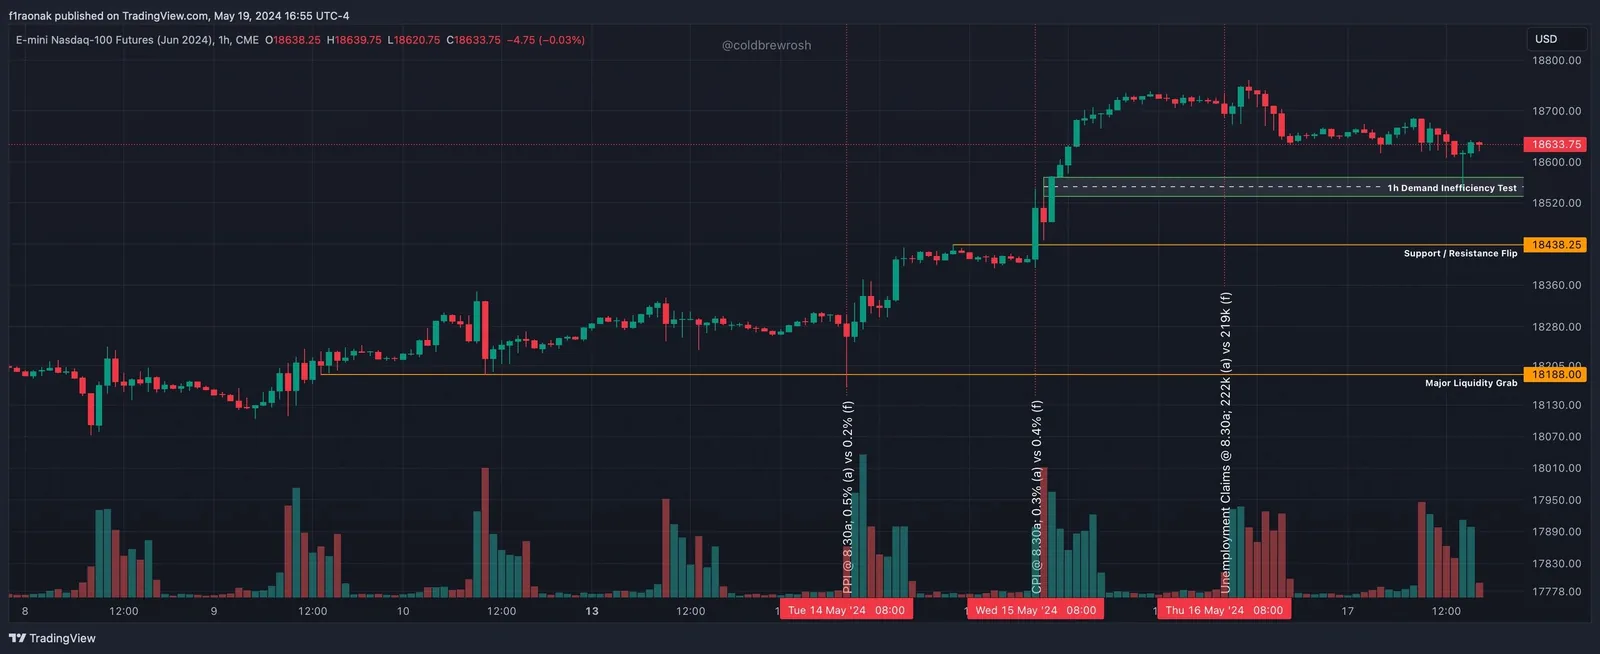
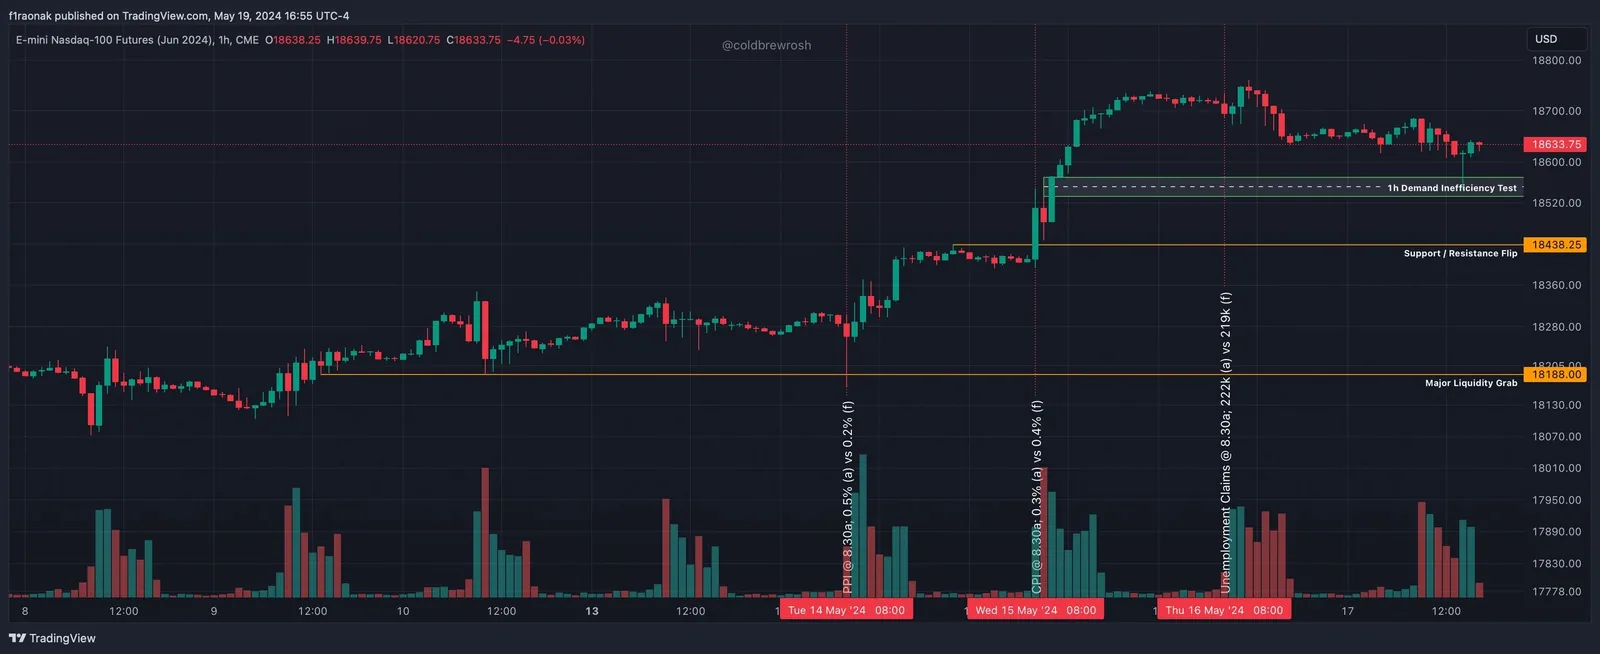
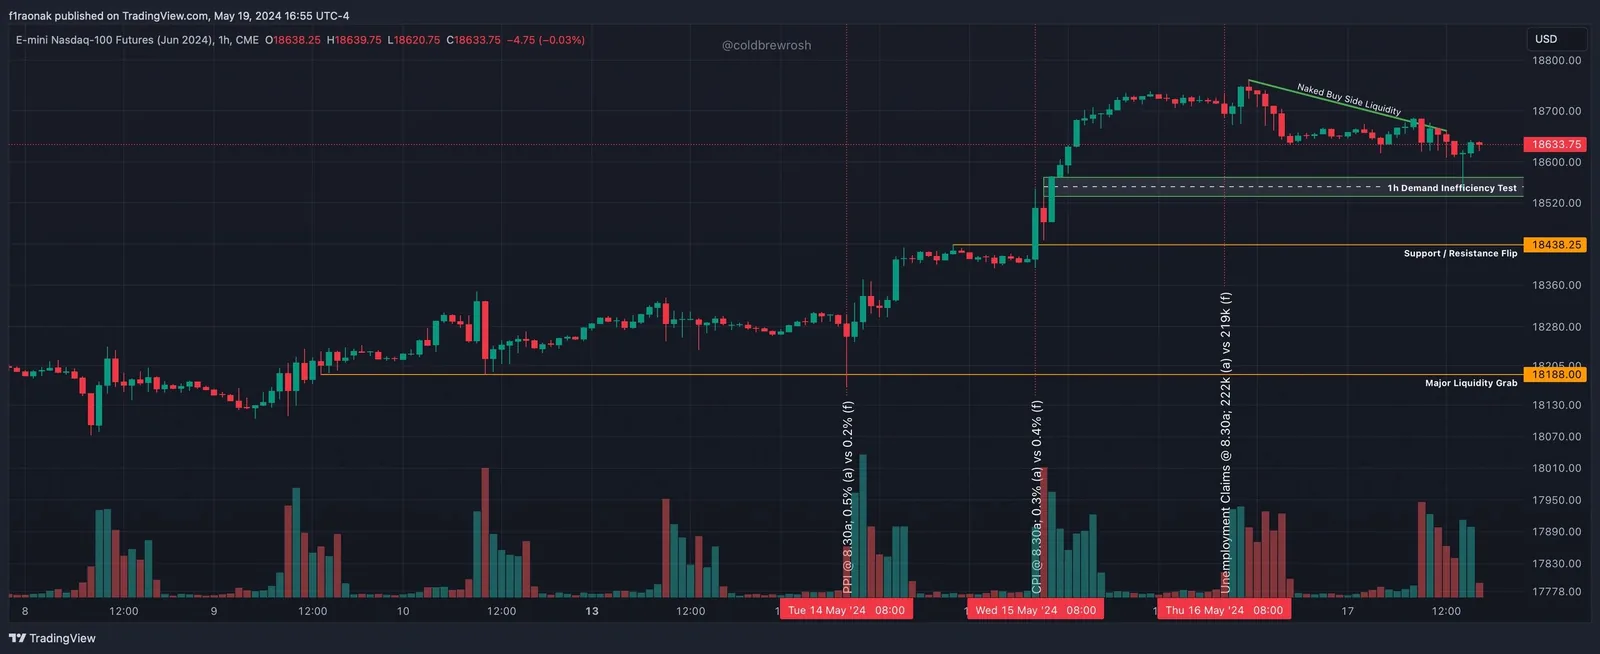
The US produce price index (PPI) came in at 0.5% above the 0.2% forecast. This means produces paid more in production costs which may lead to higher consumer prices, ie inflation goes up. However, it's a marginal increase - perhaps enough for producers to "eat it" vs pass it on. It also indicates producer demand strength and therefore further resilience of the US economy at the producer level. The market reaction was violent; price regressed into supply, took liquidity likely forcing many long contract holders out of the market via margin calls. Price took a bullish posture for the balance of the week.
The US consumer price index (CPI) came in lower tat 0.3% vs. 0.4% forecast - super bullish and what the market wanted to see. Couple that with dovish commentary from the Fed as of late, all risk assets were poised to rocket north - and they did. S&P, Dow, Bitcoin - anything with risk - moved north.
Unemployment claims came in on Thursday hotter at 222k vs 219k forecast. "Bad news is good news" season initiates as traders believe this further strengthens the case for rate cuts going into 2024 and 2025. As the economy continues to show strength in the face of one of the sharpest rate increase regimes in US history, the Fed thesis of a soft landing scenario continues to materialize.
Price regressed a bit into Friday afternoon, resting into a 1 hour inefficiency (demand side) zone before futures close.
Macro Expectations for the Week Ahead (20-24 May)
So what's on deck next week? Price is clearly in a bullish posture, the Fed may be going soft, bears are getting liquidated and forced out pressing price ever higher... the sentiment is "the trend is your friend" until it's not. Let's continue to look north. Namely, let's target the naked buy side liquidity resting below the all time high mark before another stab this week at the all time high. And likely beyond...
On the data front, we do have major news incoming:
- Monday (20-May): No red folder news though we do have Fed speakers Bostic and Barr speaking pre NY cash open
- Tuesday (21-May): No red folder news again, Treasury Sec Yellen speaking a 4a ET followed by more comments pre NY open from Waller, Barkin, Williams and Bostic (all Fed)
- Wednesday (22-May): FOMC meeting minutes release at 2:00pm ET + 2:30pm ET JPow press conference - market will look for clues from the Fed on interest rate policy changes as well as any changes in tone (currently dovish)
- Thursday (23-May): Unemployment claims, flash manufacturing and services PMI - 8.30a ET + new home sales at 10a ET
- Friday (24-May): Revised UoM Consumer Sentiment data at 10a ET
 Full-size chart
Bull Case: Most likely scenario is a consolidation phase testing Friday's range during the Monday and Tuesday NY cash sessions. Volatility on Wednesday after the Fed events drive prices north into the highlighted liquidity zones and testing all time highs again. We see potential continuation or consolidation leading into week close.
Bear Case: Price remains in consolidation testing Friday's range through Monday and Tuesday (ie, same as the bull case). However, Wednesday Fed commentary volatility takes price hard south into the 1h demand inefficiency and perhaps the levels just north of the most recent support/resistance flip level at 18,438.25. Price likely finds support there before continuing its ascent to retesting all time highs the following week.
Let's see where the chips fall.